Documentations of TEF. See quick start to know more about it.
auto_set_dtypes
auto_set_dtypes(df, max_lev=10,
  set_datetime=[], set_category=[], set_int=[], set_object=[], set_bool=[],
  set_datetime_by_pattern=r'\d{4}-\d{2}-\d{2}',
  verbose=1)
- set to datetime if the pattern is like ‘2018-08-08’
- it’s designed for all datetime columns in a dataset have the same format like 2019-06-06 06:06:06 (such as downloaded from DOMO)
- set to category if the number unique levels is less than max_lev
- set_{dtypes} can be used for manually configurations, set_object can be used for ID columns
- will also trying to detect possible ID columns for seaching string ‘id’, ‘key’, ‘number’ in them and the proportion of nunique is > 0.5, if verbose>=1
- will try to detect possible categorical variable that is currently int, by nunique < max_lev. There can be a lot, suppress these using verbose=0
- set_datetime/set_object etc can take either columns indices or column names, duplication will be ignored.
args
- df: pandas dataframe
- max_lev: the maximum number of levels that should be converted to category
- set_{datetime/category/int/object/bool}: a list of indices, e.g. [0, 3, 5], force these columns to be set to those dtypes
- set_datetime_by_pattern: a regular expression string, recommend using the default
- verbose: int/string, 0/False, 1/’summary’, or 2/’detailed’. different type of printouts showing the transformations
returns: a modified pd.dataframe
example
dfmeta
dfmeta(df, description=None, max_lev=10, transpose=True, sample=True,
  style=True, color_bg_by_type=True, highlight_nan=0.5, in_cell_next_line=True,
  drop=None,
  check_possible_error=True, dup_lev_prop=0.9,
  fitted_feat_imp=None, plot=True,
  standard=False)
- dreturns meta data for the given dataset
- use
.datato obtain the source code. Usedfmeta_to_htmlfileto save the returned object to html file - in default, for every columns it will display:
- idx shows the index of that column
- dtype, background is colored by its dtype
- description is a place that you can input your own explanation
- NaNs shows the number of nulls and its percentage. It will highlight it in red if the percentage is > 0.5, change it using
highlight_nan. - unique counts shows the number of unique values of that columns and percentage. The text will be in blue if everything is unique (percentage = 100%) and in red if everything is the same (count = 1)
- summary shows
- for datatime, quantiles [0% (min), 25%, 50% (median), 75%, 100% (max)]. It display till day level if the range of this series is larger than 1 day, else it display everything till ns
- for int and float, quantiles [0% (min), 25%, 50% (median), 75%, 100% (max)] , mean, standard error, CV (coefficient of variance, std/mean), skewness.
- the skewness will be followed by a star (*) if it doesn’t pass the normality test (skewtest), and then after removing nonpostivies and taking log, another skewtest will be applied.
- notice when applying skewtest, all nulls will automatically be removed, be cautious when it has a lot of nulls
- for bool, categoy and object, it gives percentages of all levels, if less than
max_lev. For those have more levels, it will try to summarize the rest as a “Other” level
- summary plot will call
plot_1varfor each column. In my jupyter notebook, double click on it can enlarge it - possible NaNs tries to detect potential nulls that may caused by hand-coded values, for instance, sometimes a space ‘ ‘ or a string ‘nan’ actually means a NaN. It checks “nan”, “need”, “null”, spaces and characters for now. Disable it using
check_possible_error=False. - possible dup lev tries to detect potential possible duplicate levels using fuzzywuzzy, such as sometimes ‘object1111’ should actually be the same value as ‘object111’ just because of typo. The threshold is defined by
dup_lev_prop. It will be multiplied by 100 and passed toratio,partial_ratio,token_sort_ratio, andtoken_set_ratioin fuzzywuzzy, and be displayed if any of them is larger than threshold. See its docs for explanation. - the rest 3 columns are randomly sample from the dataset, where we human always like an example. Adjust using
sample
args
- df: pandas dataframe
- description: dict, where keys are col names and values are description for that column, can contain html code
- max_lev: int, the maximum acceptable number of unique levels
- transpose: bool, if True, cols are still cols
- sample:
- True: sample 3 rows
- False: don’t sample
- ‘head’: use first 3 rows
- int: sample int rows
- style: bool, if True, return styled dataframe in html, if False, return pandas dataframe instead and will overwrites color_bg_by_type, highlight_nan, in_cell_next_line
- color_bg_by_type: bool, color the cell background by dtype, by column. will be forced to False if style=False
- highlight_nan: float [0, 1] or False, the proportion of when should highlight nans. will be forced to False if style=False
- in_cell_next_line: bool, if True, use
<br/>to separate elements in a list; if False, use ‘, ‘ - drop: columns (or rows if transpose=True) that wants to be dropped, doesn’t suppor NaNs and dtypes now
- check_possible_error: bool, check possible NaNs and duplicate levels or not
- dup_lev_prop: float [0, 1], the threshold that will be passed to fuzzywuzzy
- fitted_feat_imp: pd.series, with columns as indices. Fitted feature importance that can be generated by
TEF.fitor your own fitted model. See quick start for usage - plot: to plot for every variables or not. Will call
plot_1var. - standard: bool, to use standard settings or not. If true, sets
check_possible_error = Falseandsample = False- Notice it doesn’t affect
feat_impandplot.
- Notice it doesn’t affect
return: IPython.core.display.HTML object, if style=True (default); a pd.dataframe if style=False. Will display automatically in jupyter notebook. Use .data to obtain the source code. See example below.
example


get_desc_template
get_desc_template(df, var_name='desc', suffix_idx=False)
A function that takes the original dataframe and print a description template for user to fill in.
args
- df: pd.dataframe
- var_name: the variable name for the generated dictionary
- suffix_idx: if True, suffix “# idx” for each line, can be useful when searching in a large dataset
return: None. The template will be printed.
example
get_desc_template_file
get_desc_template_file(df, filename='desc.py', var_name='desc', suffix_idx=False)
Similar to above, will save a .py file in the working directory.
dfmeta_to_htmlfile
dfmeta_to_htmlfile(styled_df, filename, head=''):
save the styled meta dataframe to html file
args
- styled_df: IPython.core.display.HTML, the object returned by dfmeta
- filename: string, can includes file path, e.g., ‘dataset_dictionary.html’
- head: the header in that html file (in h1 tag)
- original_df: the original dataframe that was passed to dfmeta, use to generate verbose print out at the beginning of the file, can be ignored
return: None
example
summary
summary(s, max_lev=10, br_way=', ', sum_num_like_cat_if_nunique_small=5)
A function that takes a series and returns a summary string, same as the one you see in dfmeta.
arge
- s: padnas.series
- max_lev: the max level to display counts for category and object, the other will display as ‘other’
- br_way: the way to break line, can use
<br/>in order to pass to html - sum_num_like_cat_if_nunique_small: int, for int dtype, if the number of unique levels is smaller than it, it will try to summarize it like category
return: a string
example
possible_dup_lev
possible_dup_lev(series, threshold=0.9, truncate=False)
A function that will be used as possible dup lev in dfmeta. It basically just save the string pairs if
any([fuzz.ratio(l[i], l[j]) > threshold, fuzz.partial_ratio(l[i], l[j]) > threshold, fuzz.token_sort_ratio(l[i], l[j]) > threshold, fuzz.token_set_ratio(l[i], l[j]) > threshold])
It will skip object dtype if the number of levels is more than 100. You can set truncate=False or set the dtype of that column to category to force it to check, but it will take a while. For category, it checks no matter how many unique levels are there, be mindful before setting the dtype.
args
- series: pd.series
- threshold: the threshold that will be passed to fuzzywuzzy
- truncate: if True, truncate the returning string if longer than 1000. It will be set to True when calling from
dfmeta.
return: a string
plot_1var
plot_1var(df, max_lev=20, log_numeric=True, cols=None, save_plt=None)
plot a plot for every cols, according to its dtype
args
- df: pandas dataframe
- max_lev: skip if theres too many levels, no need when used auto_set_type function
- log_numeric: bool, plot two more plots for numerical which take log on it
- cols: a list of int, columns to plot, specify is you don’t want to plot all columns, can be use with
save_pltarg - save_plt: string, if not None, will save every plots to working directory, the string will be the prefix, a folder is okay but you need to creat the folder by yourself first
return: None
example
plot_1var_by_cat_y
plot_1var_by_cat_y(df, y, max_lev=20, log_numeric=True,
    kind_for_num='boxen')
plot a plot for every cols, agains the given y dependent var.
Notice saving is not implemented yet, and datetime also, and cat_y means can only handle categorical y.
args
- df: pandas dataframe
- y: string, col name of the dependent var
- max_lev: skip if theres too many levels, no need when used my auto_set_type function
- log_numeric, bool, take log on y axis if its numerical var, notice the 0’s and negatives will be removed automatically
- kind_for_num: string, ‘boxen’, ‘box’, ‘violin’, ‘strip’ (not recommend for big dataset), ‘swarm’ (not recommend for big dataset), the type of plot for numerical vars
example
fit
fit(df, y_name, verbose=1, max_lev=10, transform_date=True, transform_time=False, impute=True,
    CV=5, class_weight='balanced', use_metric=None, return_agg_feat_imp=False)
A universal function that will detect the data type of prediction variable (y_name) in the dataframe (df) and call corresponding fitting function.
Notice for now it only deals with classification problem, i.e., it will only call fit_classification for category and bool y.
args
- df: pandas dataframe
- y_name: string, column name of y variable, should be included in the df
- verbose: int, 0 to 3, control the amount of printouts
- max_lev: the maximum level to convert categorical variables to dummies
- transform_date: bool, whether to transform all datetime variable to year, month, week, dayofweek
- transform_time: bool, whether to transform all datetime variable to hour, minute, second
- impute: bool, whether impute the missing values or not, if False, will drop every rows that contains NaNs
- CV: int, the number of folds for cross validation
- class_weight: string, ‘balanced’ or None, the type of weighting for classification will be passed to LogisticRegression, RandomForestClassifier, LinearSVC, and XGBClassifier
- use_metric: string, ‘f1’ or ‘f1_weighted’ for classification takse; ‘neg_mean_squared_error’ or ‘r2’ for regression, the metric to select the final model after model comparison. ‘f1’ can be applied only for binary classification while ‘f1_weighted’ can by used for multiclass. the default is ‘f1_weighted’ for classification and ‘neg_mean_squared_error’ for regression
- return_agg_feat_imp: bool, whether to return a series of summarized feature importance or not, then can be passed to dfmeta
This function calls the following function by order, which should be intuitive to understand by their names
- LinearRegression(),LinearRegression(),LinearRegression(),LinearRegression(),data_preprocess
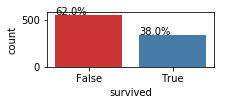
- print the distribution bar plot of y
- select X by dtypes
- remove columns with too many levels (max_lev)
- engineer on datetime variables
- impute missing values or drop
- print the distribution of y again
- convert all bool and category to dummies
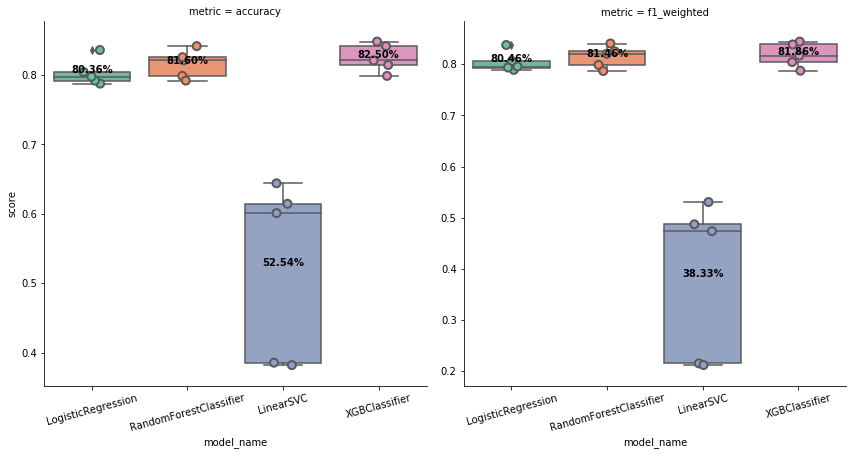
- model_selection
- does CV-fold cross validation on 4 classification models
- for now, the defaults are
- for classification:
LogisticRegression(random_state=random_state, class_weight=class_weight, solver='lbfgs', multi_class='auto')RandomForestClassifier(random_state=random_state, class_weight=class_weight, n_estimators=100),LinearSVC(random_state=random_state, class_weight=class_weight)XGBClassifier(random_state=random_state, scale_pos_weight=y.value_counts(normalize=True).iloc[0] if class_weight=='balanced' and binary else 1)
- for regression:
LinearRegression()LassoCV(random_state=random_state, cv=CV)RandomForestRegressor(random_state=random_state)XGBRegressor(random_state=random_state, objective='reg:squarederror')
- plot boxplots for them
- does CV-fold cross validation on 4 classification models
- train_test_CV
- train using the best model from above again, with another random state
- classification_result
- print classification report and scores
- coef_to_feat_imp
- transform coefficient matrix to a single feature importance array by taking absolute maximum, if the model is using coefficients (e.g. Logistic)
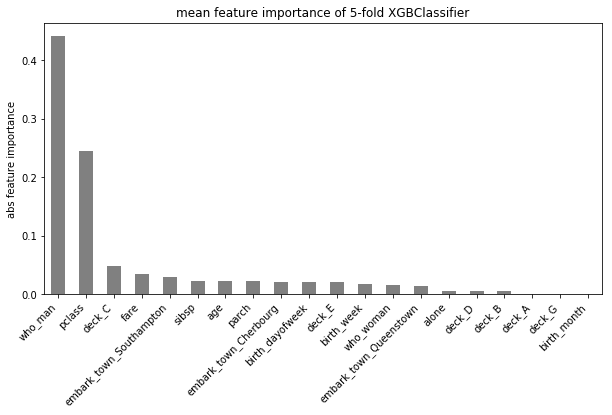
- plot_detailed_feature_importance or plot_summary_feature_importance
- plot_detailed tries to plot all feature importance for multi-class problem
- plot_summary only plots the abs max one
- agg_feat_imp if return_agg_feat_imp is True
- transform the dummies back, e.g., if variable “class” contains 3 levels, “A”, “B”, “C”, it will be converted to dummy variables “class_A”, “class_B”, “class_C”, and it has three feature importance on them. Here it takes the abs max and converted it back to one single “class”.
- warning: it use column names for matching, therefore, it will cause confusion if it has same pattern for different columns, e.g., column like “cla_A” will be counted toward “class” LinearRegression(),
example

Utility Functions
reorder_col
reorder_col(df, to_move, after=None, before=None)
Reorder the columns, by specifying the one to move and where. At least one of the argument after or before should be given. Return the modified dataframe.
args
- df: pandas dataframe
- to_move: string, the name of the column to be moved
- after/before: string, the name of the columns that should move to_move to
return: pd.dataframe
example
rename_cols_by_words
rename_cols_by_words(df, words=[], mapper={}, verbose=1)
NOTE: Think twice before using this function! Sometimes some of the column names get too long with this logic, in that case, I personally wouldn’t specify any words.
A function that rename the columns by
- replacing space ‘ ‘ with ‘_’
- so that you can use
d.col_nameinstead ofd['col_name']
- so that you can use
- rename column names by mapper dictionary
- rename by detecting given words in the column names, separate word by word with ‘_’
args
- df: pandas dataframe
- words: list of strings, words that should be detected and separated
- mapper: dict, where keys are column name before renaming and values are after
- verbose: int, 0, 1, 2, how many message you want to print out
return: pd.dataframe
example
convert_column_list
convert_column_list(columns, idx_or_labels, to_idx_only=False, to_label_only=False)
Convert a list of either indices or labels of columns to either indices or labels.
args
- columns: pandas.column
- idx_or_labels: list, can be a mix of labels of columns
- to_idx_only: if True, convert idx_or_labels all to indices
- to_label_only: if True, convert idx_or_labels all to labels
If to_idx_only and to_label_only are both False (default), will convert index to label and label to index.
return: list
example
ct
ct(s1, s2, style=True, col_name=None, sort=False, head=False)
An enhancement of pd.crosstab, generate counts and proportion (nomalize='index') using pd.crosstab. Colored background by columns.
args
- s1: pandas.Series
- s2: pandas.Series
- style: bool, to color the background or not
- col_name: list, same length of
s2.unique(), rename the column name - sort: tuple or bool, sort the output dataframe. If
sort == True, it is equivalent tosort = (s2.name, 'count', 'All'), other usage likesort = (s2.name , 'proportion', True) - head: int or False, the number of head to return
return: pandas.io.formats.style.Styler
example
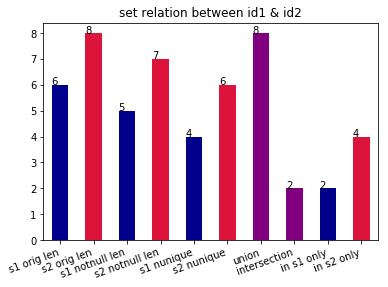
set_relation
set_relation(s1, s2, plot=True)
Return the union, intersection, and different of two series. And plot.
args
- s1: pandas.Series
- s2: pandas.Series
- plot: bool, plot or not
return: pd.series
example
correspondence
correspondence(s1, s2, verbose=1, fillna=True)
Return the counts (and keys of 1-1 correspondence, 1-m (many), m-1, m-m.
args
- s1: pandas.Series
- s2: pandas.Series
- verbose: int, the amount of printouts
- fillna: bool, if False, every nan will be treated as an independent value (Python’s default, nan != nan). this may cause a extreme heavy computation for a big dataset (about 2h for a million elements).
example
return: dictionary